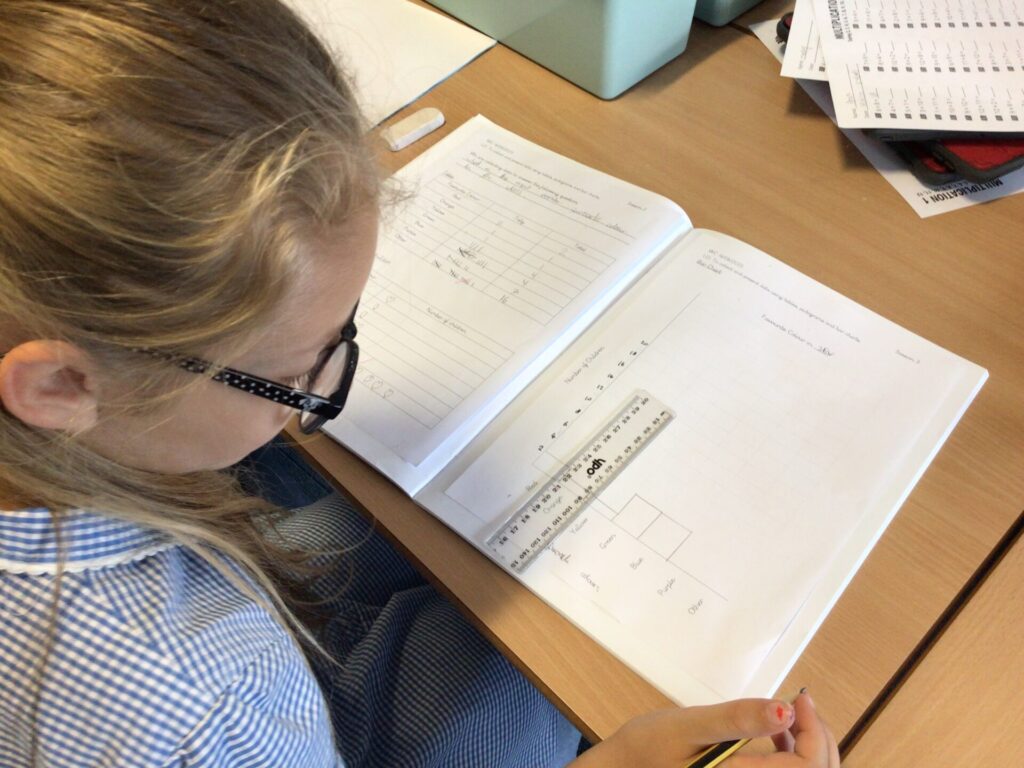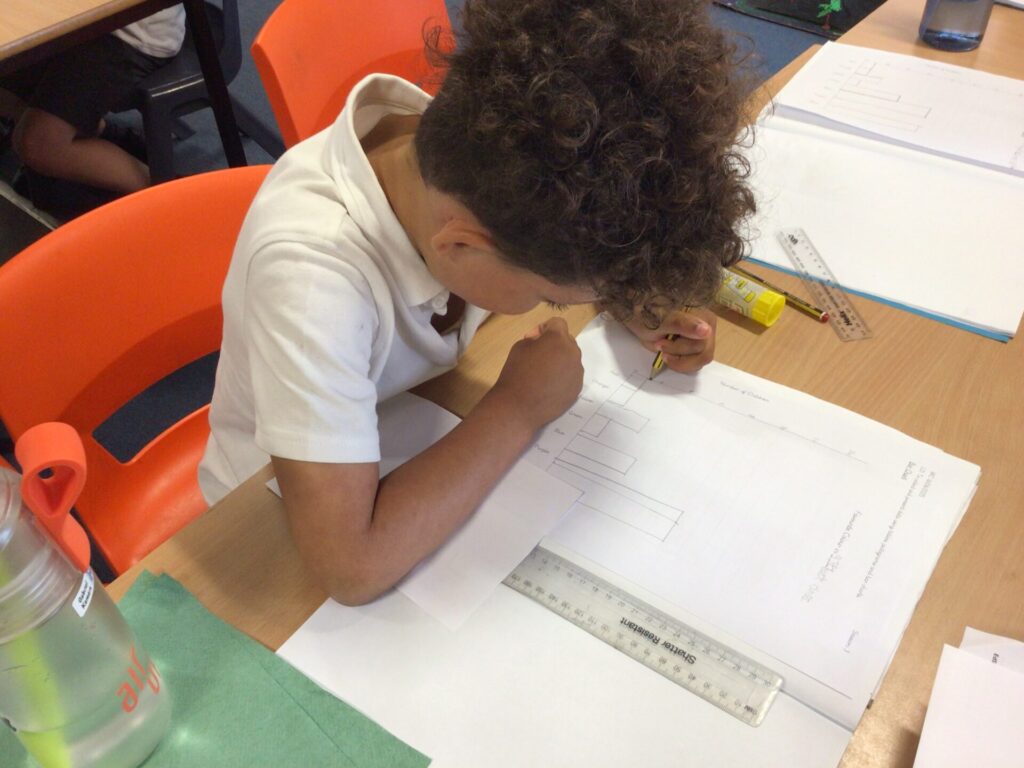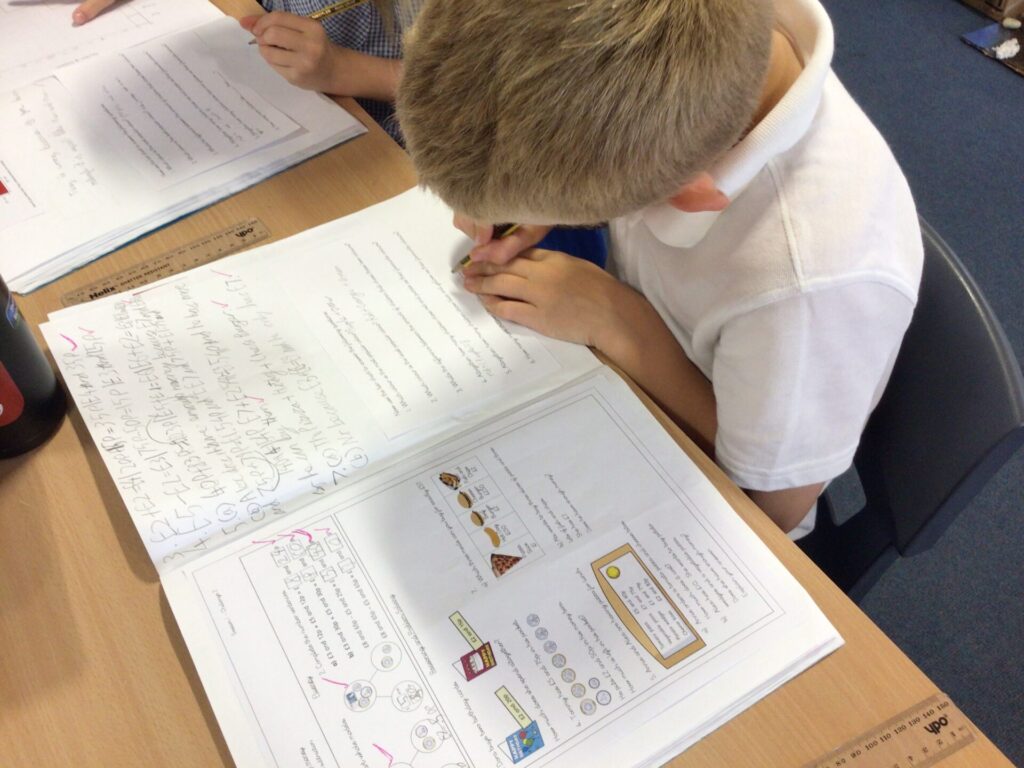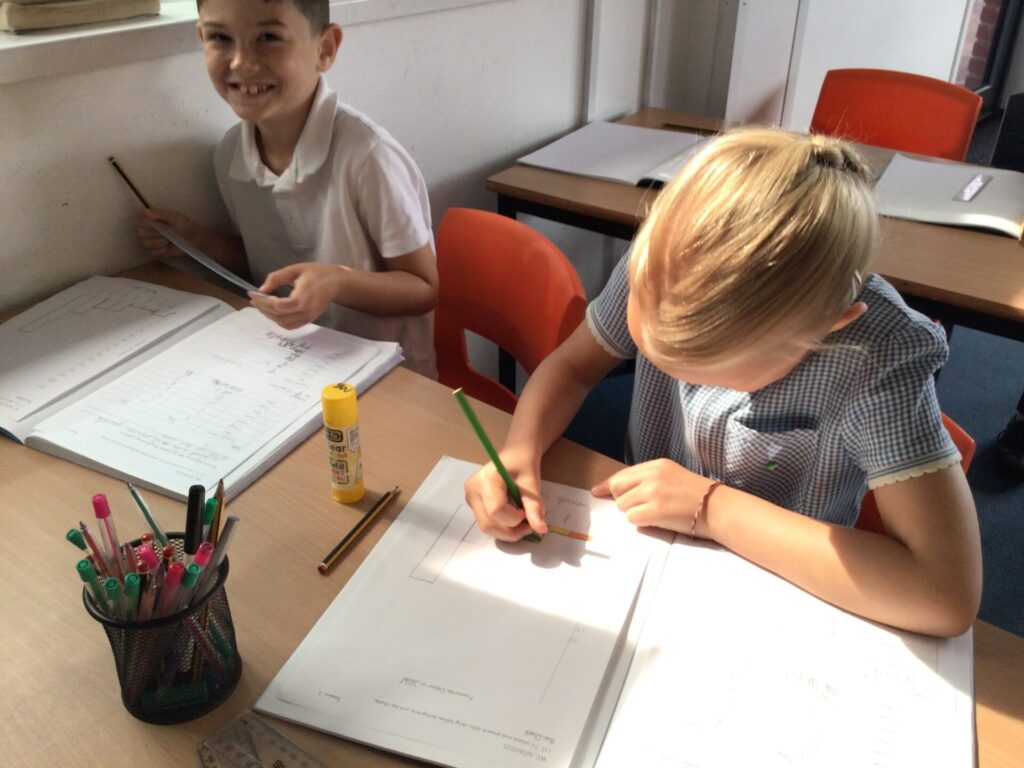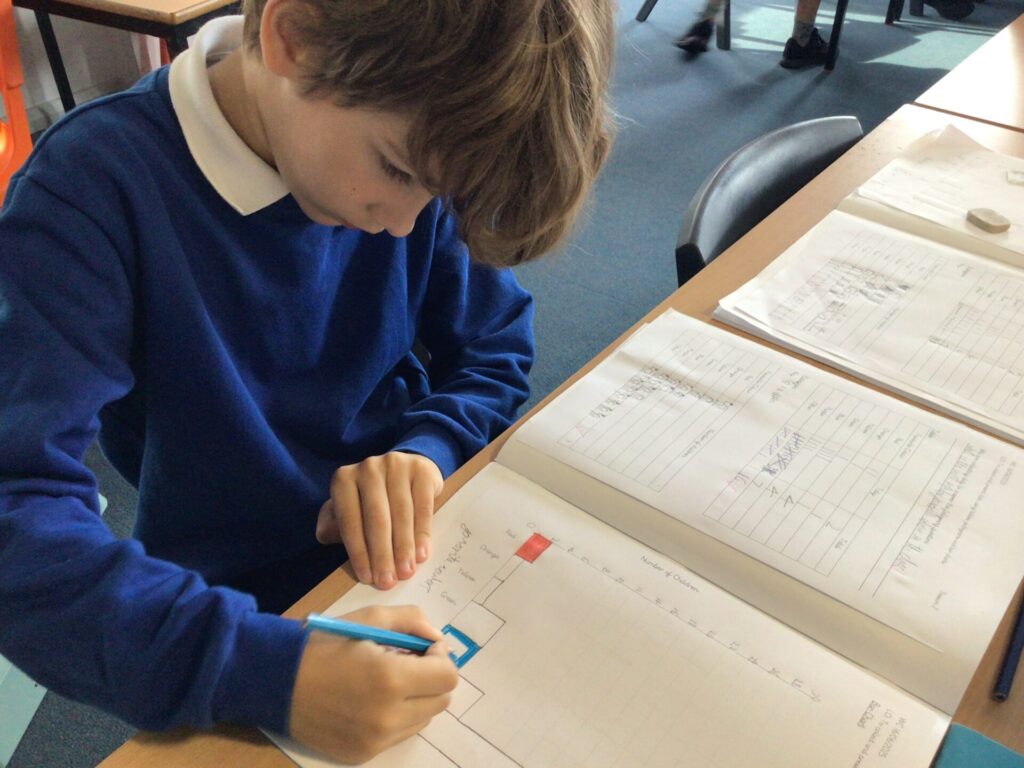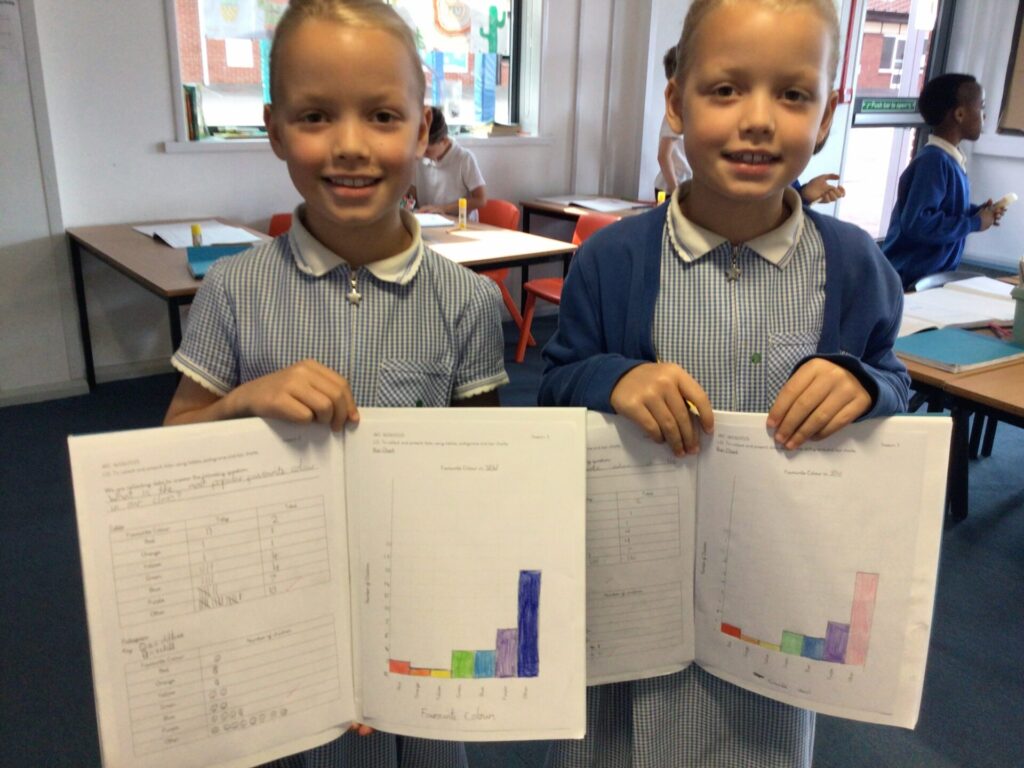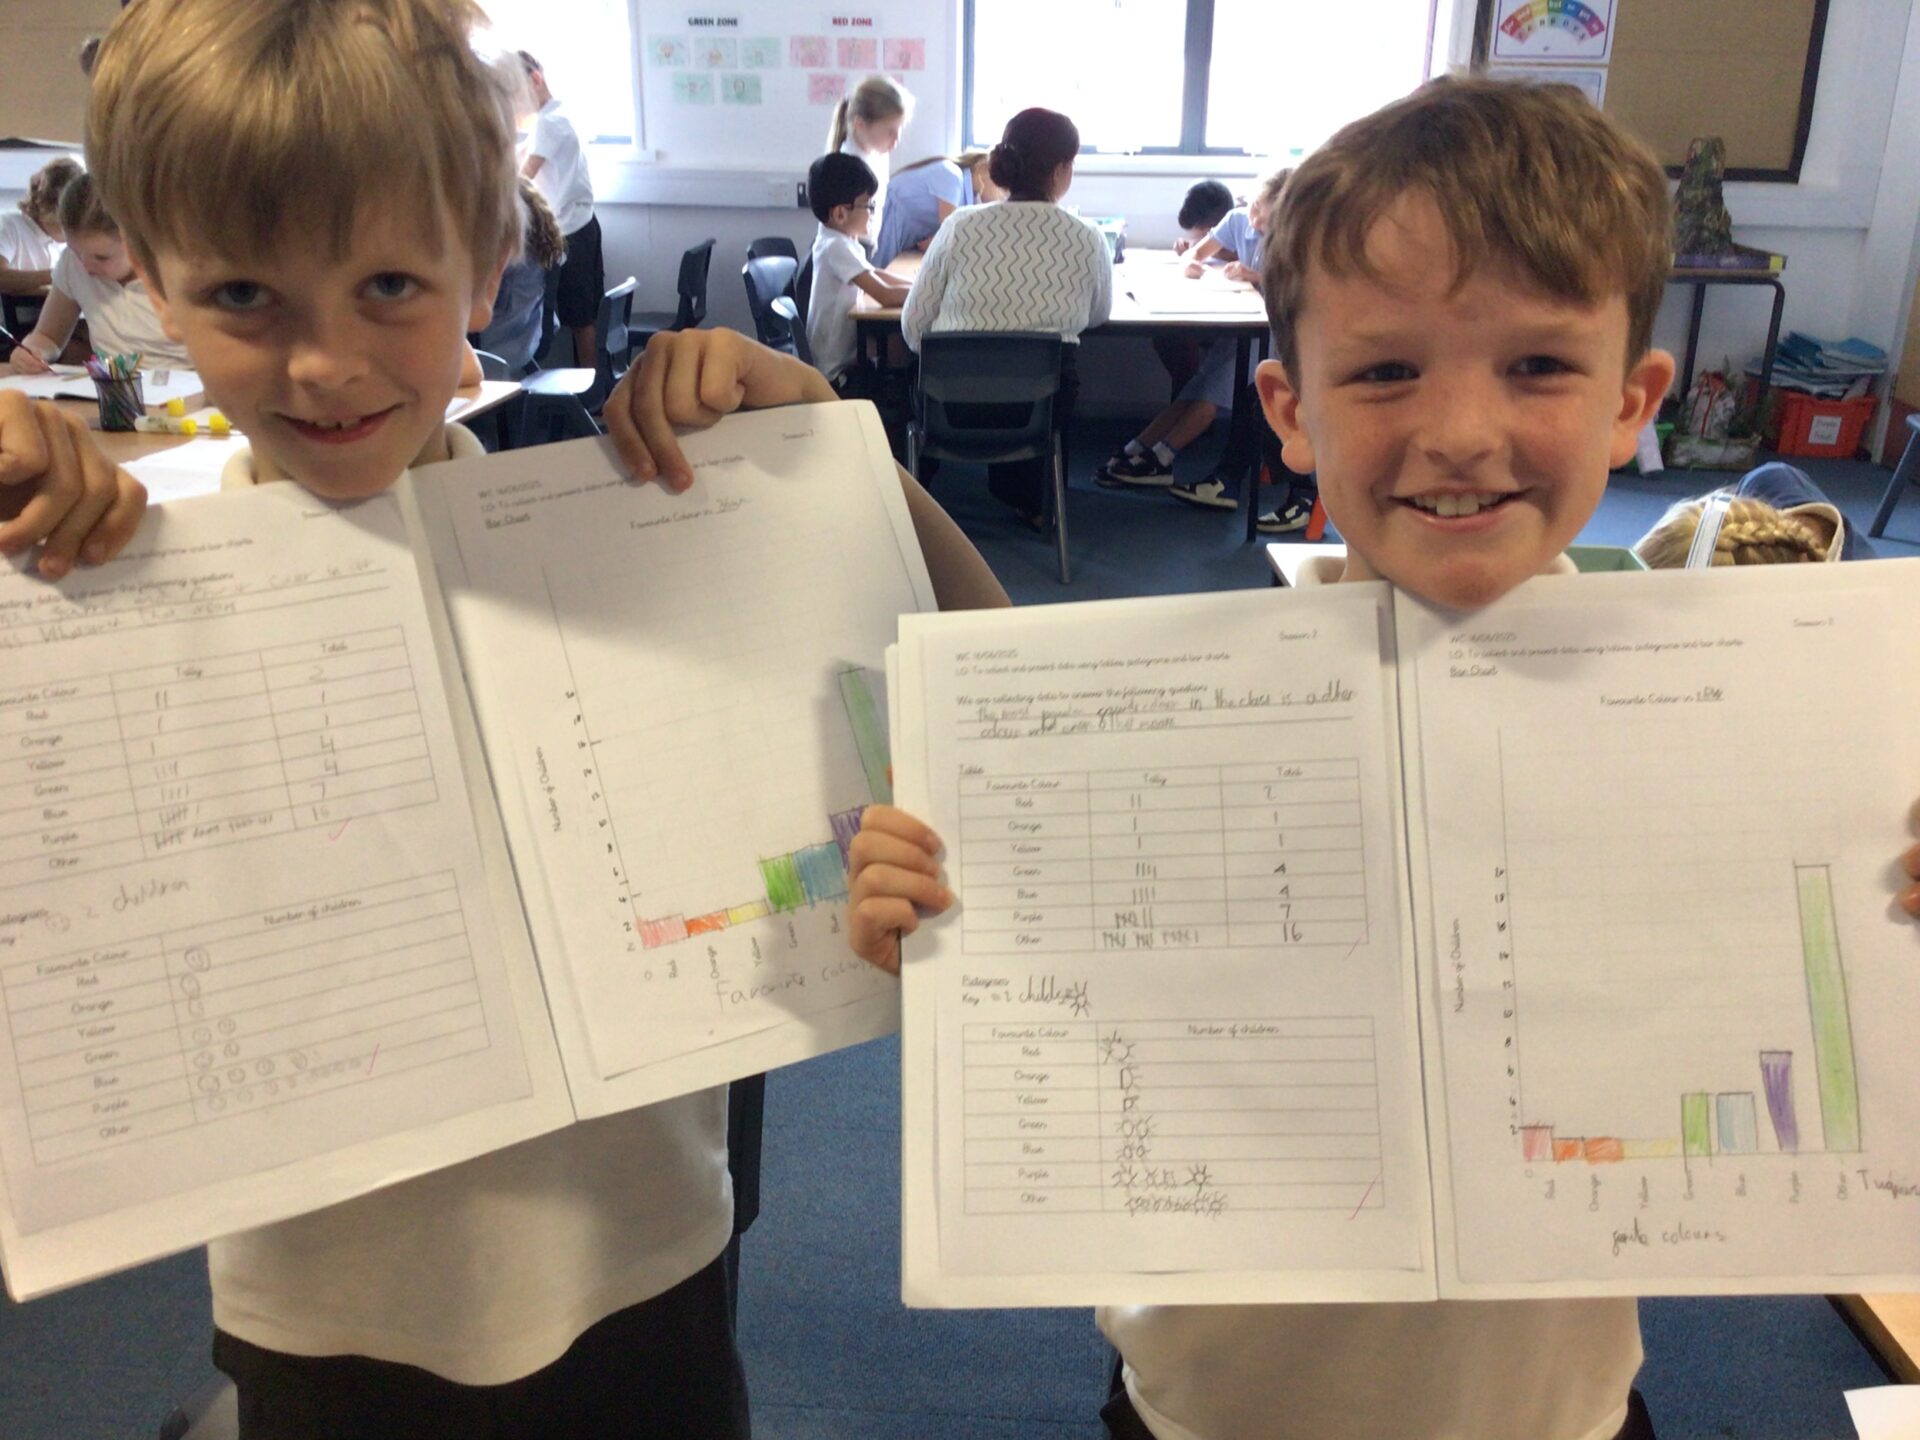
Over the last two weeks, Year 3 have been focussing on statistics in Maths. They began interpreting data in the form of pictograms, tally charts and bar charts, before collecting their own data. They then represented this data on pictograms and bar charts of their own. They have done a fantastic job and really shown their understanding of interpreting and presenting data. Here are a few examples from 3BW and 3JE.